Level up your shell history with Loki and fzf
Loki expands the model Prometheus uses for metrics for monitoring and log aggregation
Loki is an Apache 2.0-licensed open source log-aggregation framework designed by Grafana Labs and built with tremendous support from a growing community. It is also the project I work on every day.
In this article, rather than just talking about how Loki works, I will provide a hands-on introduction to solving real problems with it.
The problem: a durable centralized shell history
I love my shell history and have always been a fanatical CTRL+R user. I learned the command-line fuzzy finder fzf.
Suddenly, searching through commands went from this:
Before Loki and FzF
(Ed Welch, CC BY-SA 4.0)
To this:
After Loki and FzF
(Ed Welch, CC BY-SA 4.0)
While fzf significantly improved my quality of life, there were still some pieces missing around my shell history:
- Losing shell history when terminals close abruptly, computers crash, computers die, whole disk encryption keys are forgotten
- Having access to my shell history from all my computers on all my computers
I think of my shell history as documentation: it’s an important story I don’t want to lose. Combining Loki with my shell history helps solve these problems and more.
Get started
Ready to give it a try? The following guide will help you set up and run Loki to be integrated with your shell history.
Since this tutorial aims to keep things simple, this setup will run Loki locally on your computer and store all the files on the filesystem.
You can find all of this, plus information about how to set up a more elaborate installation, in the loki-shell GitHub repository.
Note that this tutorial will not change any existing behaviors around your history, so your existing shell history command and history settings will be untouched.
Instead, this duplicates the command history to Loki with $PROMPT_COMMAND in Bash and precmd in Zsh. On the CTRL+R side of things, it overloads the function that fzf uses to access the CTRL+R command. Trying this is safe, and if you decide you don’t like it, just follow the uninstall steps in the GitHub repo to remove all traces. Your shell history will be untouched.
Step 1: Install fzf
There are several ways to install fzf, but I prefer the Git method:
git clone --depth 1 https://github.com/junegunn/fzf.git ~/.fzf
~/.fzf/install
Say yes to all the question prompts.
If you already have fzf installed, make sure you have the key bindings enabled (i.e., make sure when you type CTRL+R, fzf pops up). You can rerun the fzf installation to enable key bindings if necessary.
Step 2: Install loki-shell
Like fzf, loki-shell also has a Git repo and install script:
git clone --depth 1 https://github.com/slim-bean/loki-shell.git ~/.loki-shell
~/.loki-shell/install
First, the script creates the ~/.loki-shell directory where all files will be kept (including Loki data). Next, it will download binaries for Promtail, LogCLI, and Loki.
Then it will ask:
Do you want to install Loki? ([y]/n)
If you already have a centralized Loki running for loki-shell, you could answer n; however, for this tutorial, answer y or press Enter.
There are two options available for running Loki locally: as a Docker image or as a single binary (with support for adding a systemd service). I recommend using Docker if it’s available, as I think it simplifies operations a bit, but both work just fine.
Running with Docker
To run Loki as a Docker image:
[y] to run Loki in Docker, [n] to run Loki as a binary ([y]/n) y
Error: No such object: loki-shell
Error response from daemon: No such container: loki-shell
Error: No such container: loki-shell
54843ff3392f198f5cac51a6a5071036f67842bbc23452de8c3efa392c0c2e1e
If this is the first time you’re running the installation, you can disregard the error messages. This script will stop and replace a running Loki container if the version does not match, which allows you to rerun this script to upgrade Loki.
That’s it! Loki is now running as a Docker container.
Data from Loki will be stored in ~/.loki-shell/data.
The image runs with --restart=unless-stopped, so it will restart at reboot but will stay stopped if you run docker stop loki-shell.
(If you’re using Docker, you can skip down to Shell integration.)
Running as binary
There are many ways to run a binary on a Linux system. This script can install a systemd service. If you don’t have systemd, you can still use the binary install:
[y] to run Loki in Docker, [n] to run Loki as a binary ([y]/n) n

Run Loki with systemd? ([y]/n) n

This is as far as this script can take you
You will need to setup an auto-start for Loki
It can be run with this command: /home/username/.loki-shell/bin/loki -config.file=/home/username/.loki-shell/config/loki-binary-config.yaml
The script will spit out the command you need to use to run Loki, and you will be on your own to set up an init script or another method of auto-starting it.
You can run the command directly, if you want, and run Loki from your current shell.
If you do have systemd, you have the option of letting the script install the systemd service or showing you the commands to run it yourself:
Run Loki with systemd? ([y]/n) y

Installing the systemd service requires root permissions.
[y] to run these commands with sudo [n] to print out the commands and you can run them yourself. ([y]/n) n
sudo cp /home/ed/.loki-shell/config/loki-shell.service /etc/systemd/system/loki-shell.service
sudo systemctl daemon-reload
sudo systemctl enable loki-shell
sudo systemctl start loki-shell
Copy these commands and run them when the script finishes. (press enter to continue)
Shell integration
Regardless of how you installed Loki, you should now see a prompt:
Enter the URL for your Loki server or press enter for default (http://localhost:4100)
If you had set up a centralized Loki, you would enter that URL here. However, this demo just uses the default, so you can press Enter.
A lot of text will spit out explaining all the entries added to your ~.bashrc or ~.zshrc (or both).
That’s it!
Finished. Restart your shell or reload config file.
   source ~/.bashrc  # bash
   source ~/.zshrc   # zsh
Start using your shell, and use CTRL+R to see your commands.
Open multiple terminal windows, type a command in one and CTRL+R in another, and you’ll see your commands available immediately.
Also, notice that when you switch between terminals and enter commands, they are available immediately with CTRL+R, but the Up arrow’s operation is not affected between terminals. (This may not be true if you have Oh My Zsh installed, as it automatically appends all commands to the history.)
Use CTRL+R multiple times to toggle between sorting by time and by relevance.
Note that this configuration will show only the current hosts’ query history, even if you are sending shell data from multiple hosts to Loki. I think by default this makes the most sense. There is a lot you can tweak if you want this behavior to change; see the loki-shell repo to learn more.
It also installed an alias called hist:
alias hist="$HOME/.loki-shell/bin/logcli --addr=$LOKI_URL"
LogCLI can be used to query and search your history directly in Loki, including allowing you to search other hosts. Check out the getting started guide for LogCLI to learn more about querying.
Loki’s log query language (LogQL) provides metric queries that allow you to do some interesting things; for example, I can see how many times I issued the kc command (my alias for kubectl) in the last 30 days:
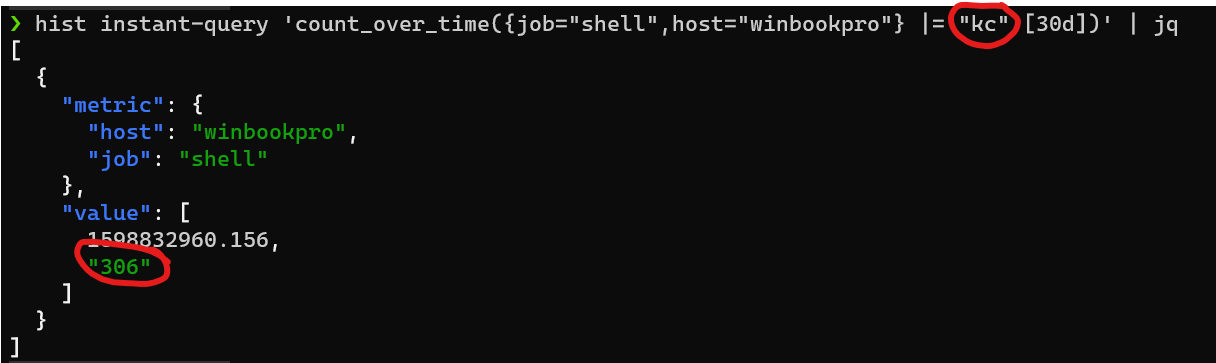
Counting use of a command
(Ed Welch, CC BY-SA 4.0)
Extra credit
Install Grafana and play around with your shell history:
docker run -d -p 3000:3000 --name=grafana grafana/grafana
Open a web browser at http://localhost:3000 and log in using the default admin/admin username and password.
On the left, navigate to Configuration -> Datasources, click the Add Datasource button, and select Loki.
For the URL, you should be able to use http://localhost:4100.
Click Save and Test. You should see Data source connected and labels found.
Click on the Explore icon on the left, make sure the Loki data source is selected, and try out a query:
{job="shell"}
If you have more hosts sending shell commands, you can limit the results to a certain host using the hostname label:
{job="shell", hostname="myhost"}.
You can also look for specific commands with filter expressions:
{job="shell"} |= "docker"
Or you can start exploring the world of metrics from logs to see how often you are using your shell:
rate({job="shell"}[1m])
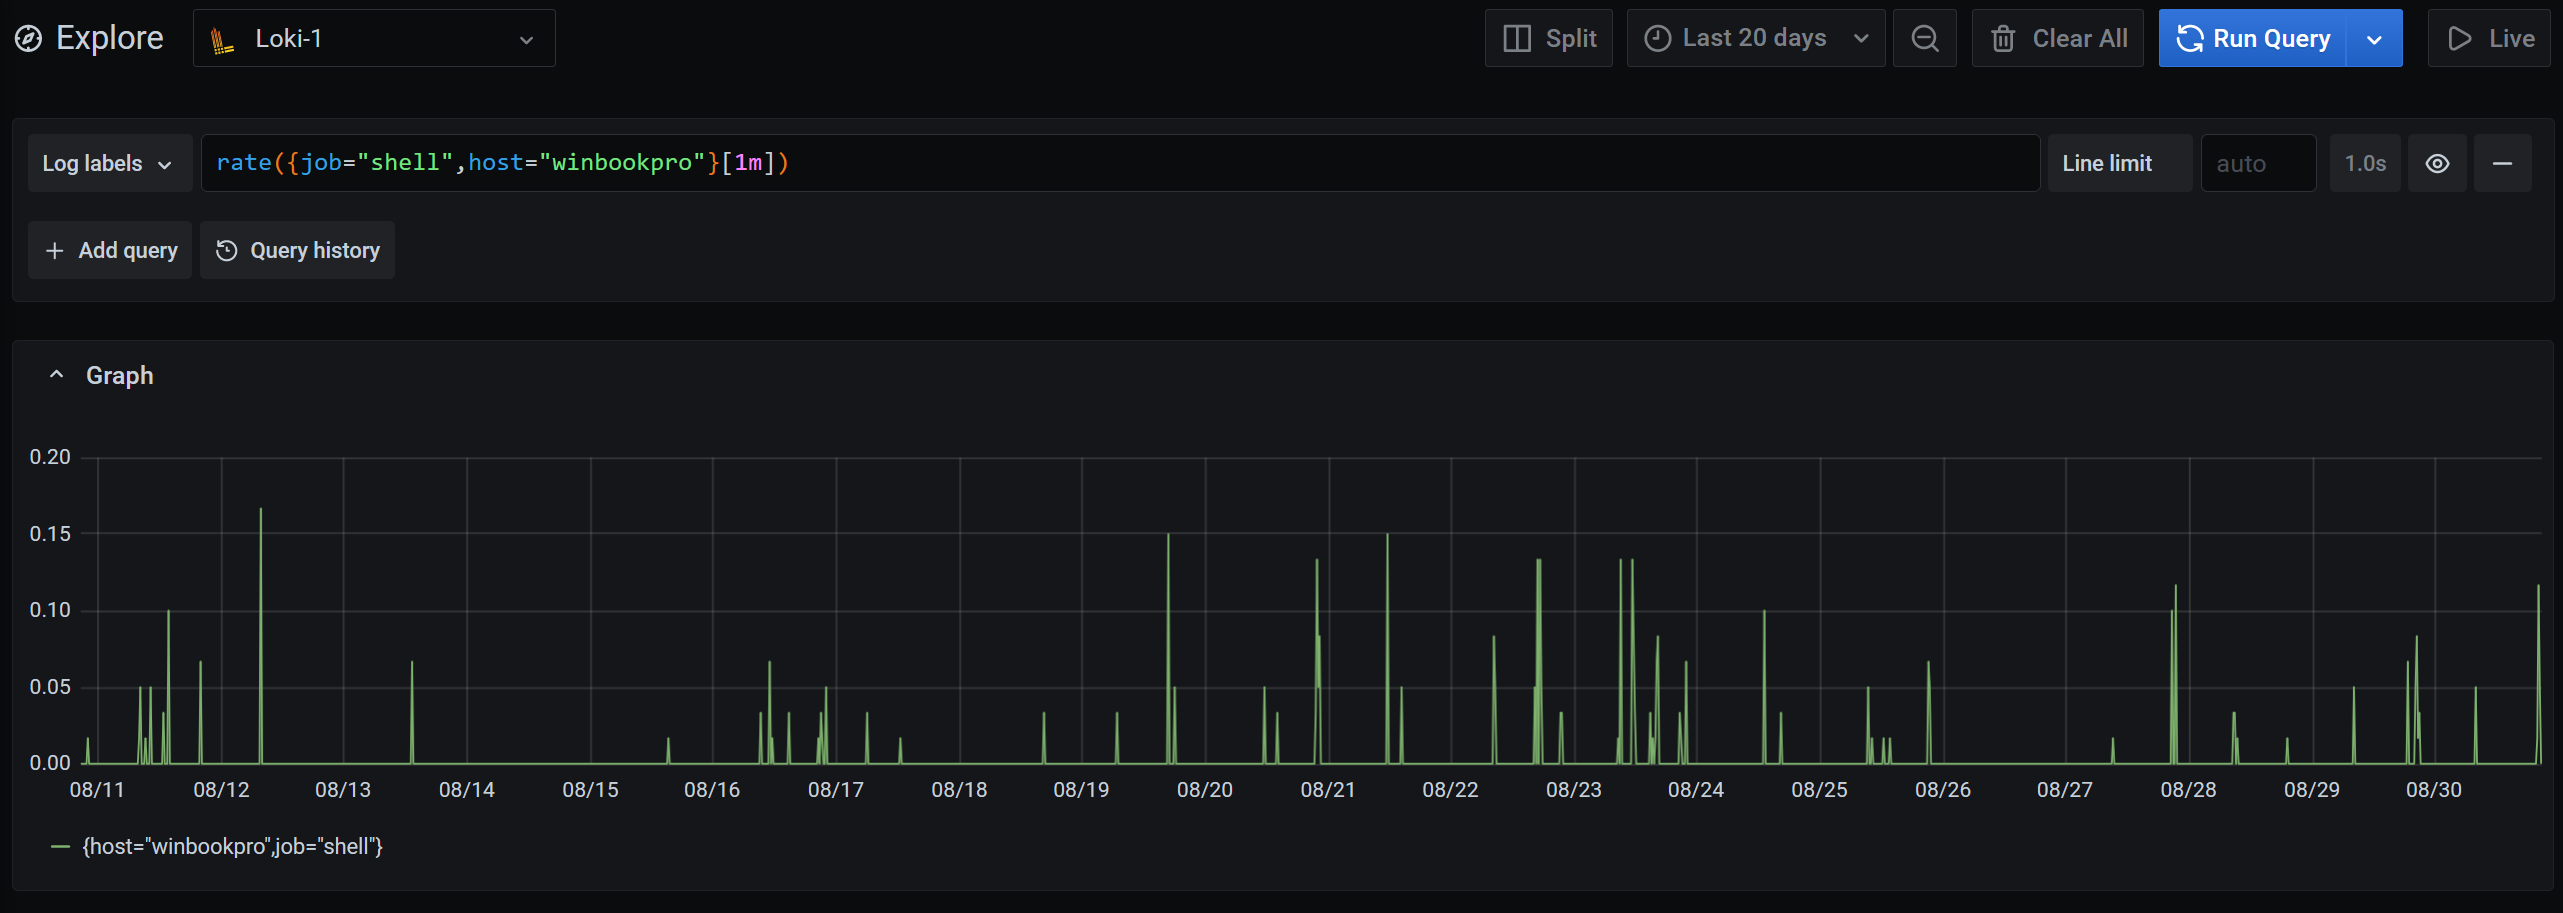
Counting use of the shell over previous 20 days
(Ed Welch, CC BY-SA 4.0)
Want to reconstruct a timeline from an incident? You can filter by a specific command and see when it ran.
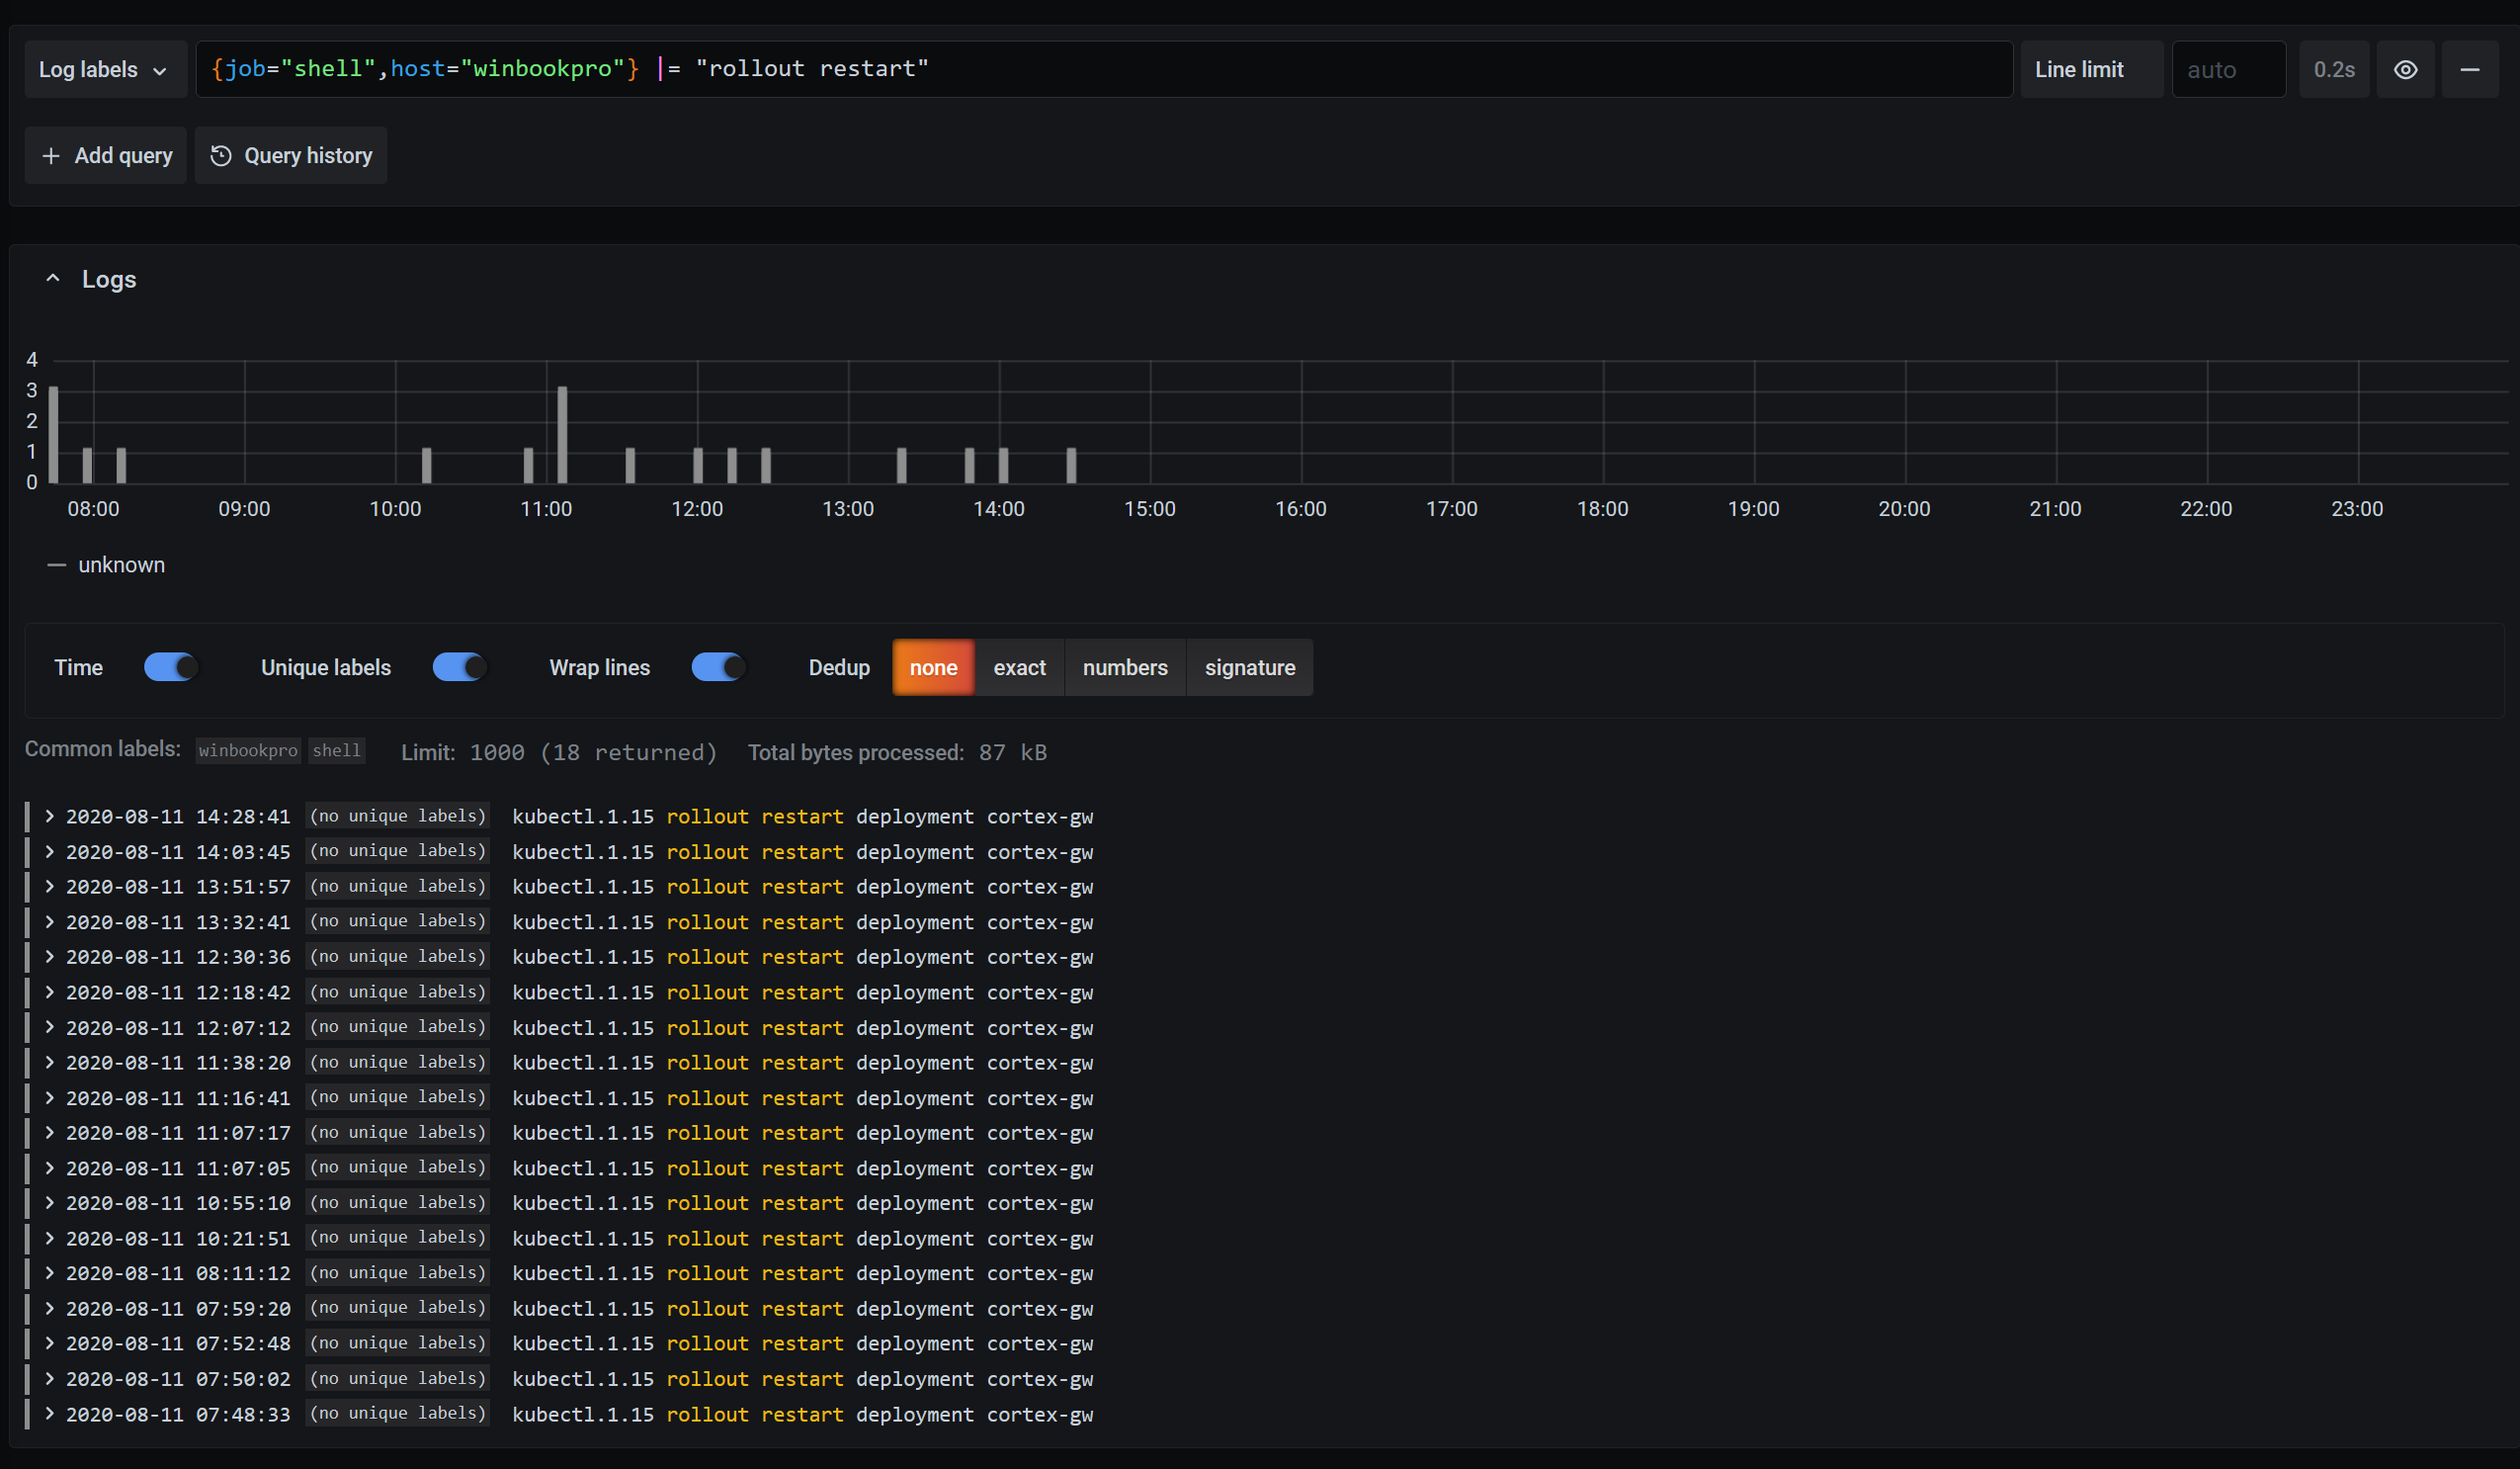
Counting use of command
(Ed Welch, CC BY-SA 4.0)
To see what else you can do and learn more about Loki’s query language, check out the LogQL guide.
Final thoughts
For more ideas, troubleshooting, and updates, follow the GitHub repo. This is still a work in progress, so please report any issues there.
To learn more about Loki, check out the documentation, blog posts, and GitHub repo, or try it in Grafana Cloud.